Single Cell RNA-Seq
Overview
Single cell RNA-Seq is a next-generation sequencing (NGS) application that allows analysis and comparison of the transcriptomes of individual cells. Analyzing the heterogeneity of cells can identify rare cell populations and trace lineage of development.
General Workflow
A typical single cell RNA-Seq experimental workflow involves the isolation of single intact cells or nuclei. Polyadenylated mRNA is captured using oligo dT primers, converted to cDNA, ligated with NGS platform adaptors, amplified by indexed PCR, pooled, and sequenced by NGS.
Data Analysis
SciDAP is a no-code bioinformatics platform that enables scientists to analyze NGS-based data without a bioinformatician. It has built-in pipelines based on open-source workflows, specific to analyzing gene expression at the single-cell level.
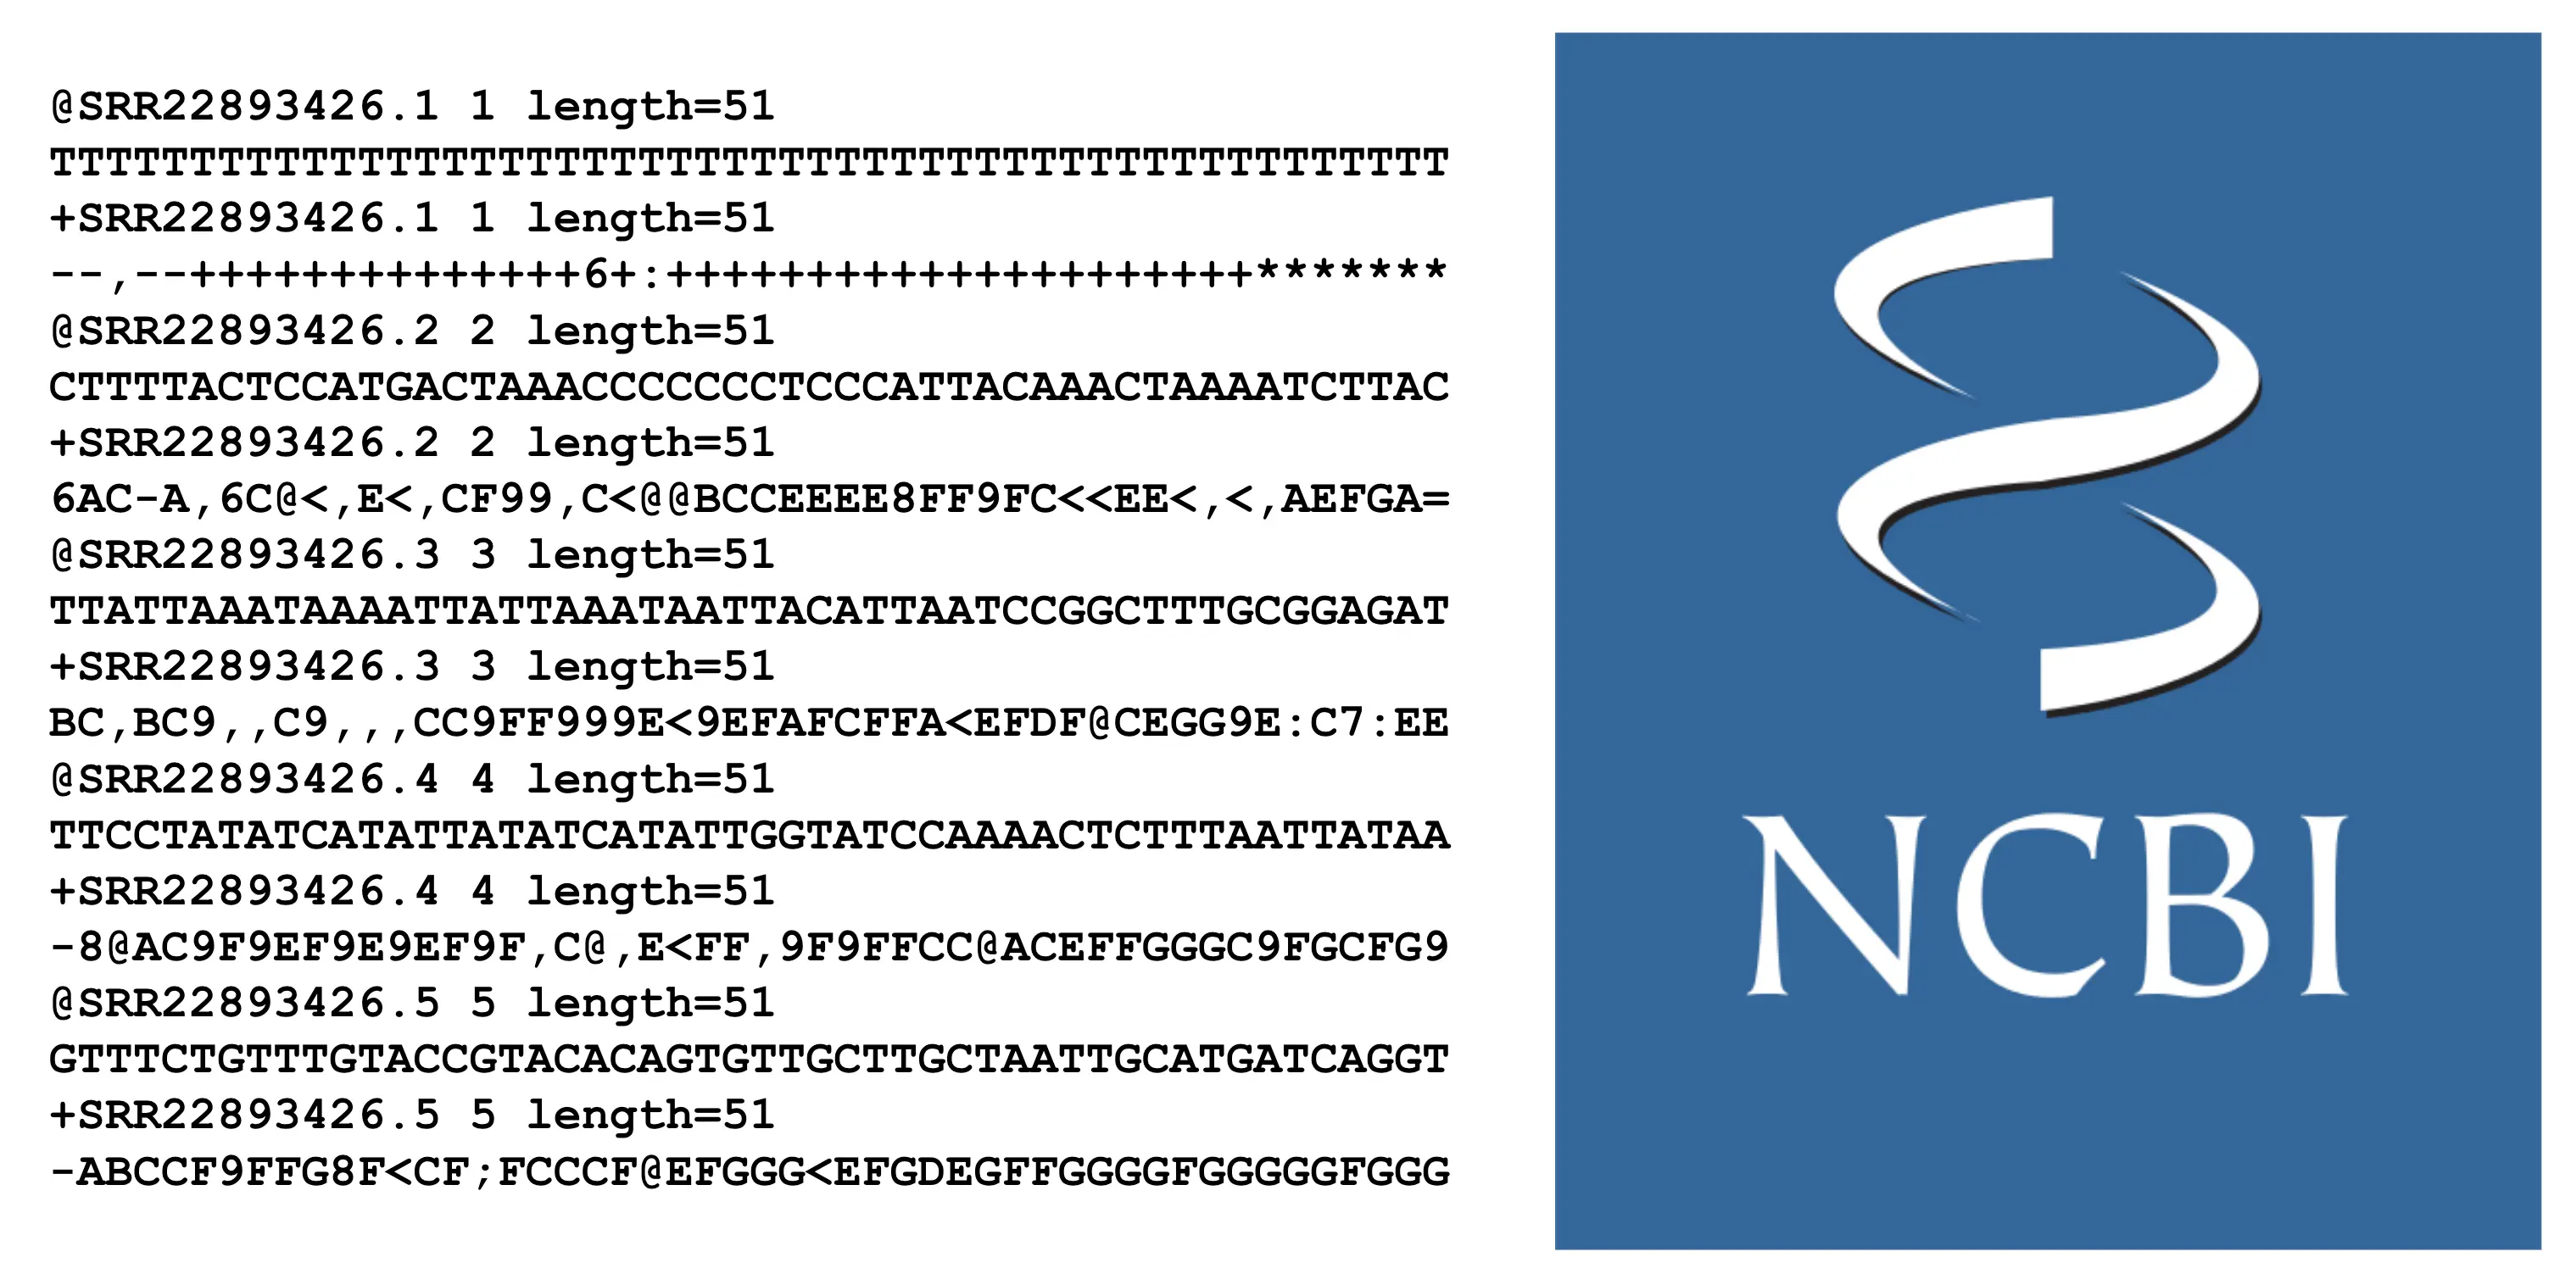
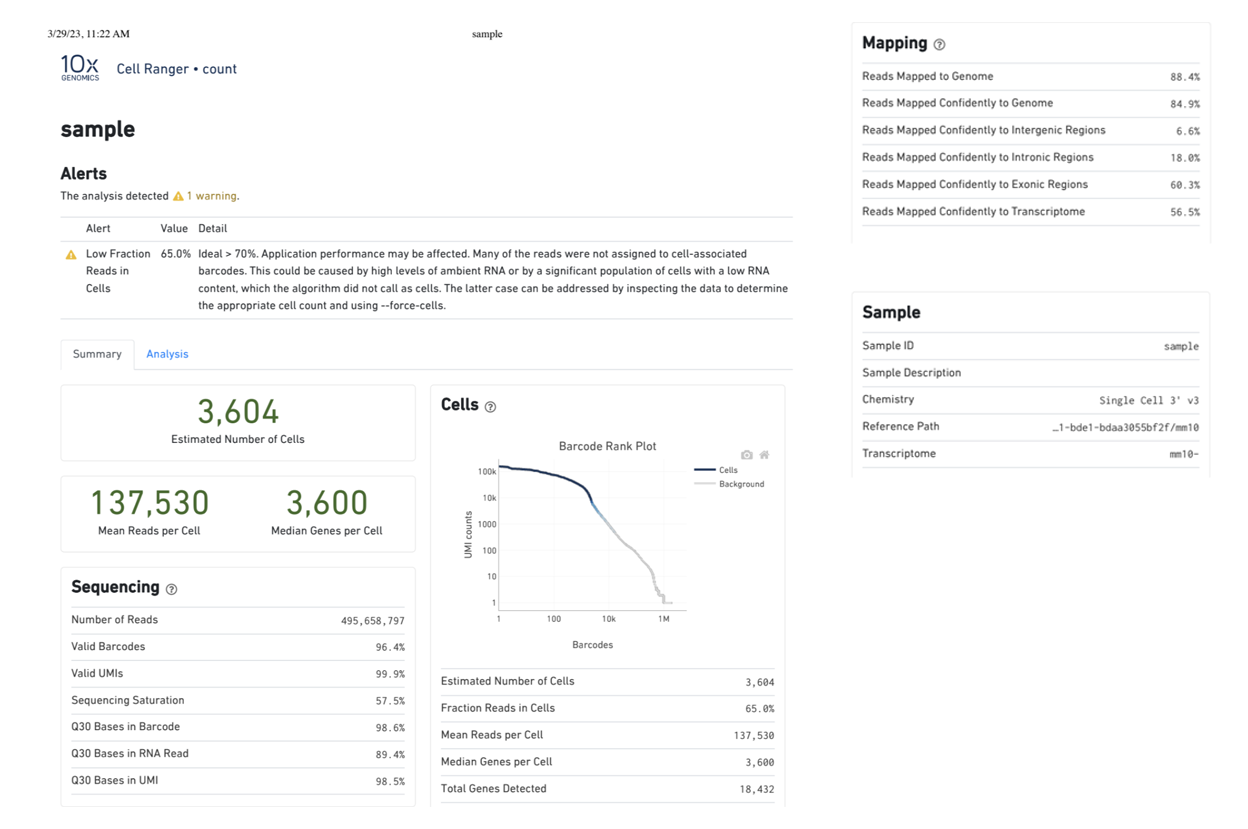
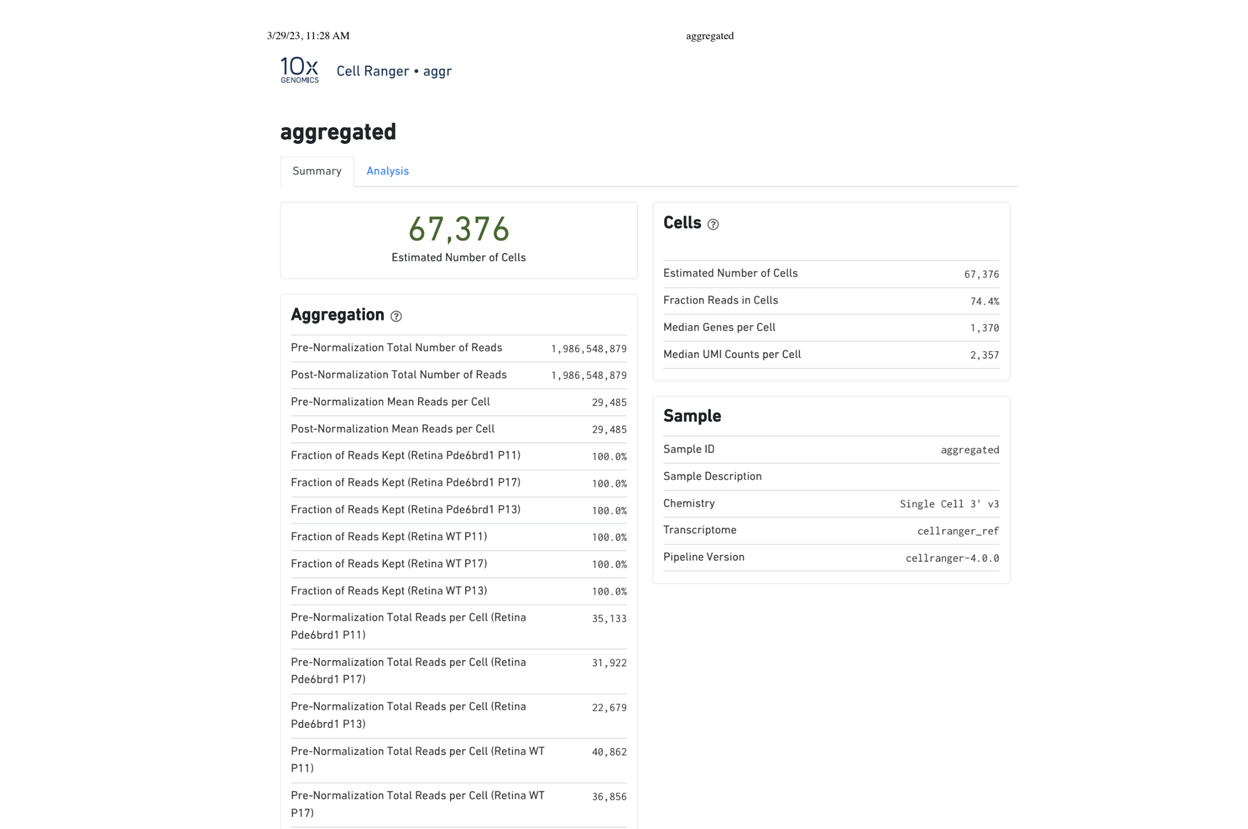
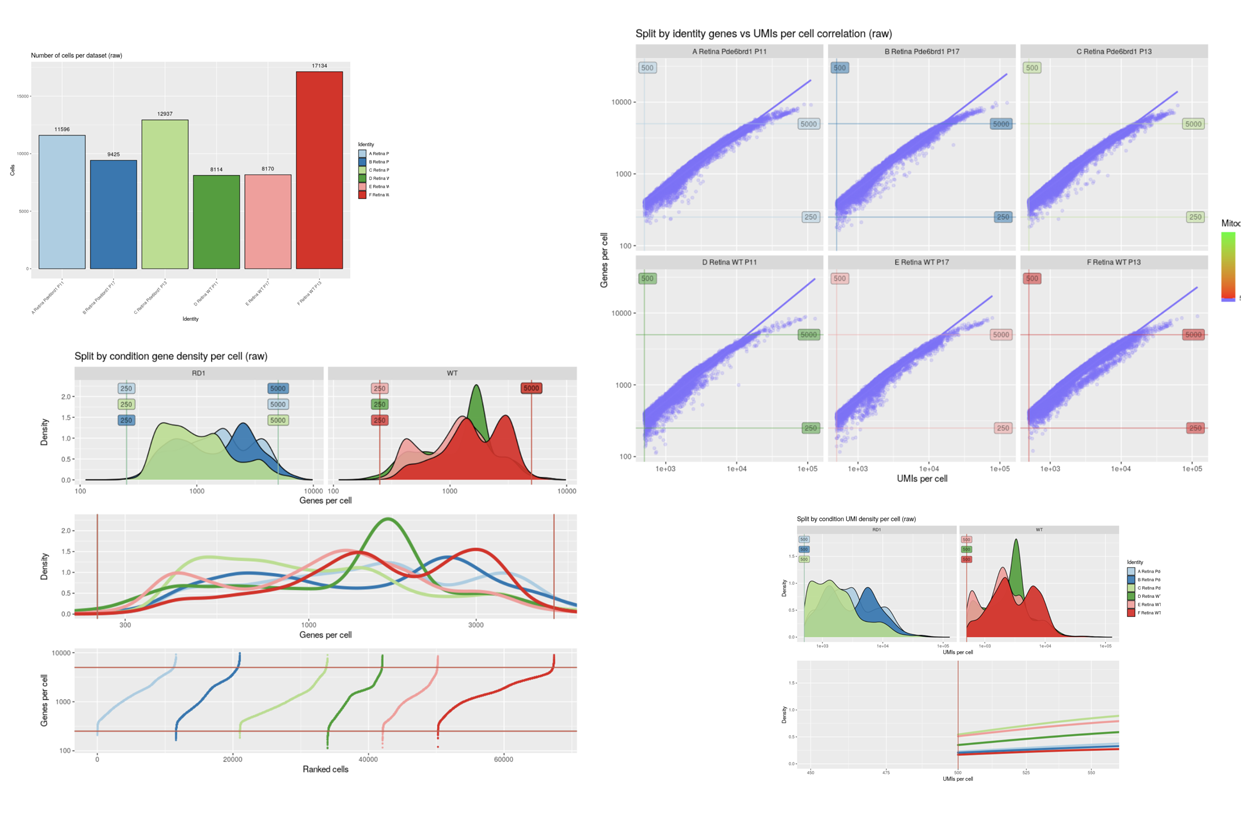
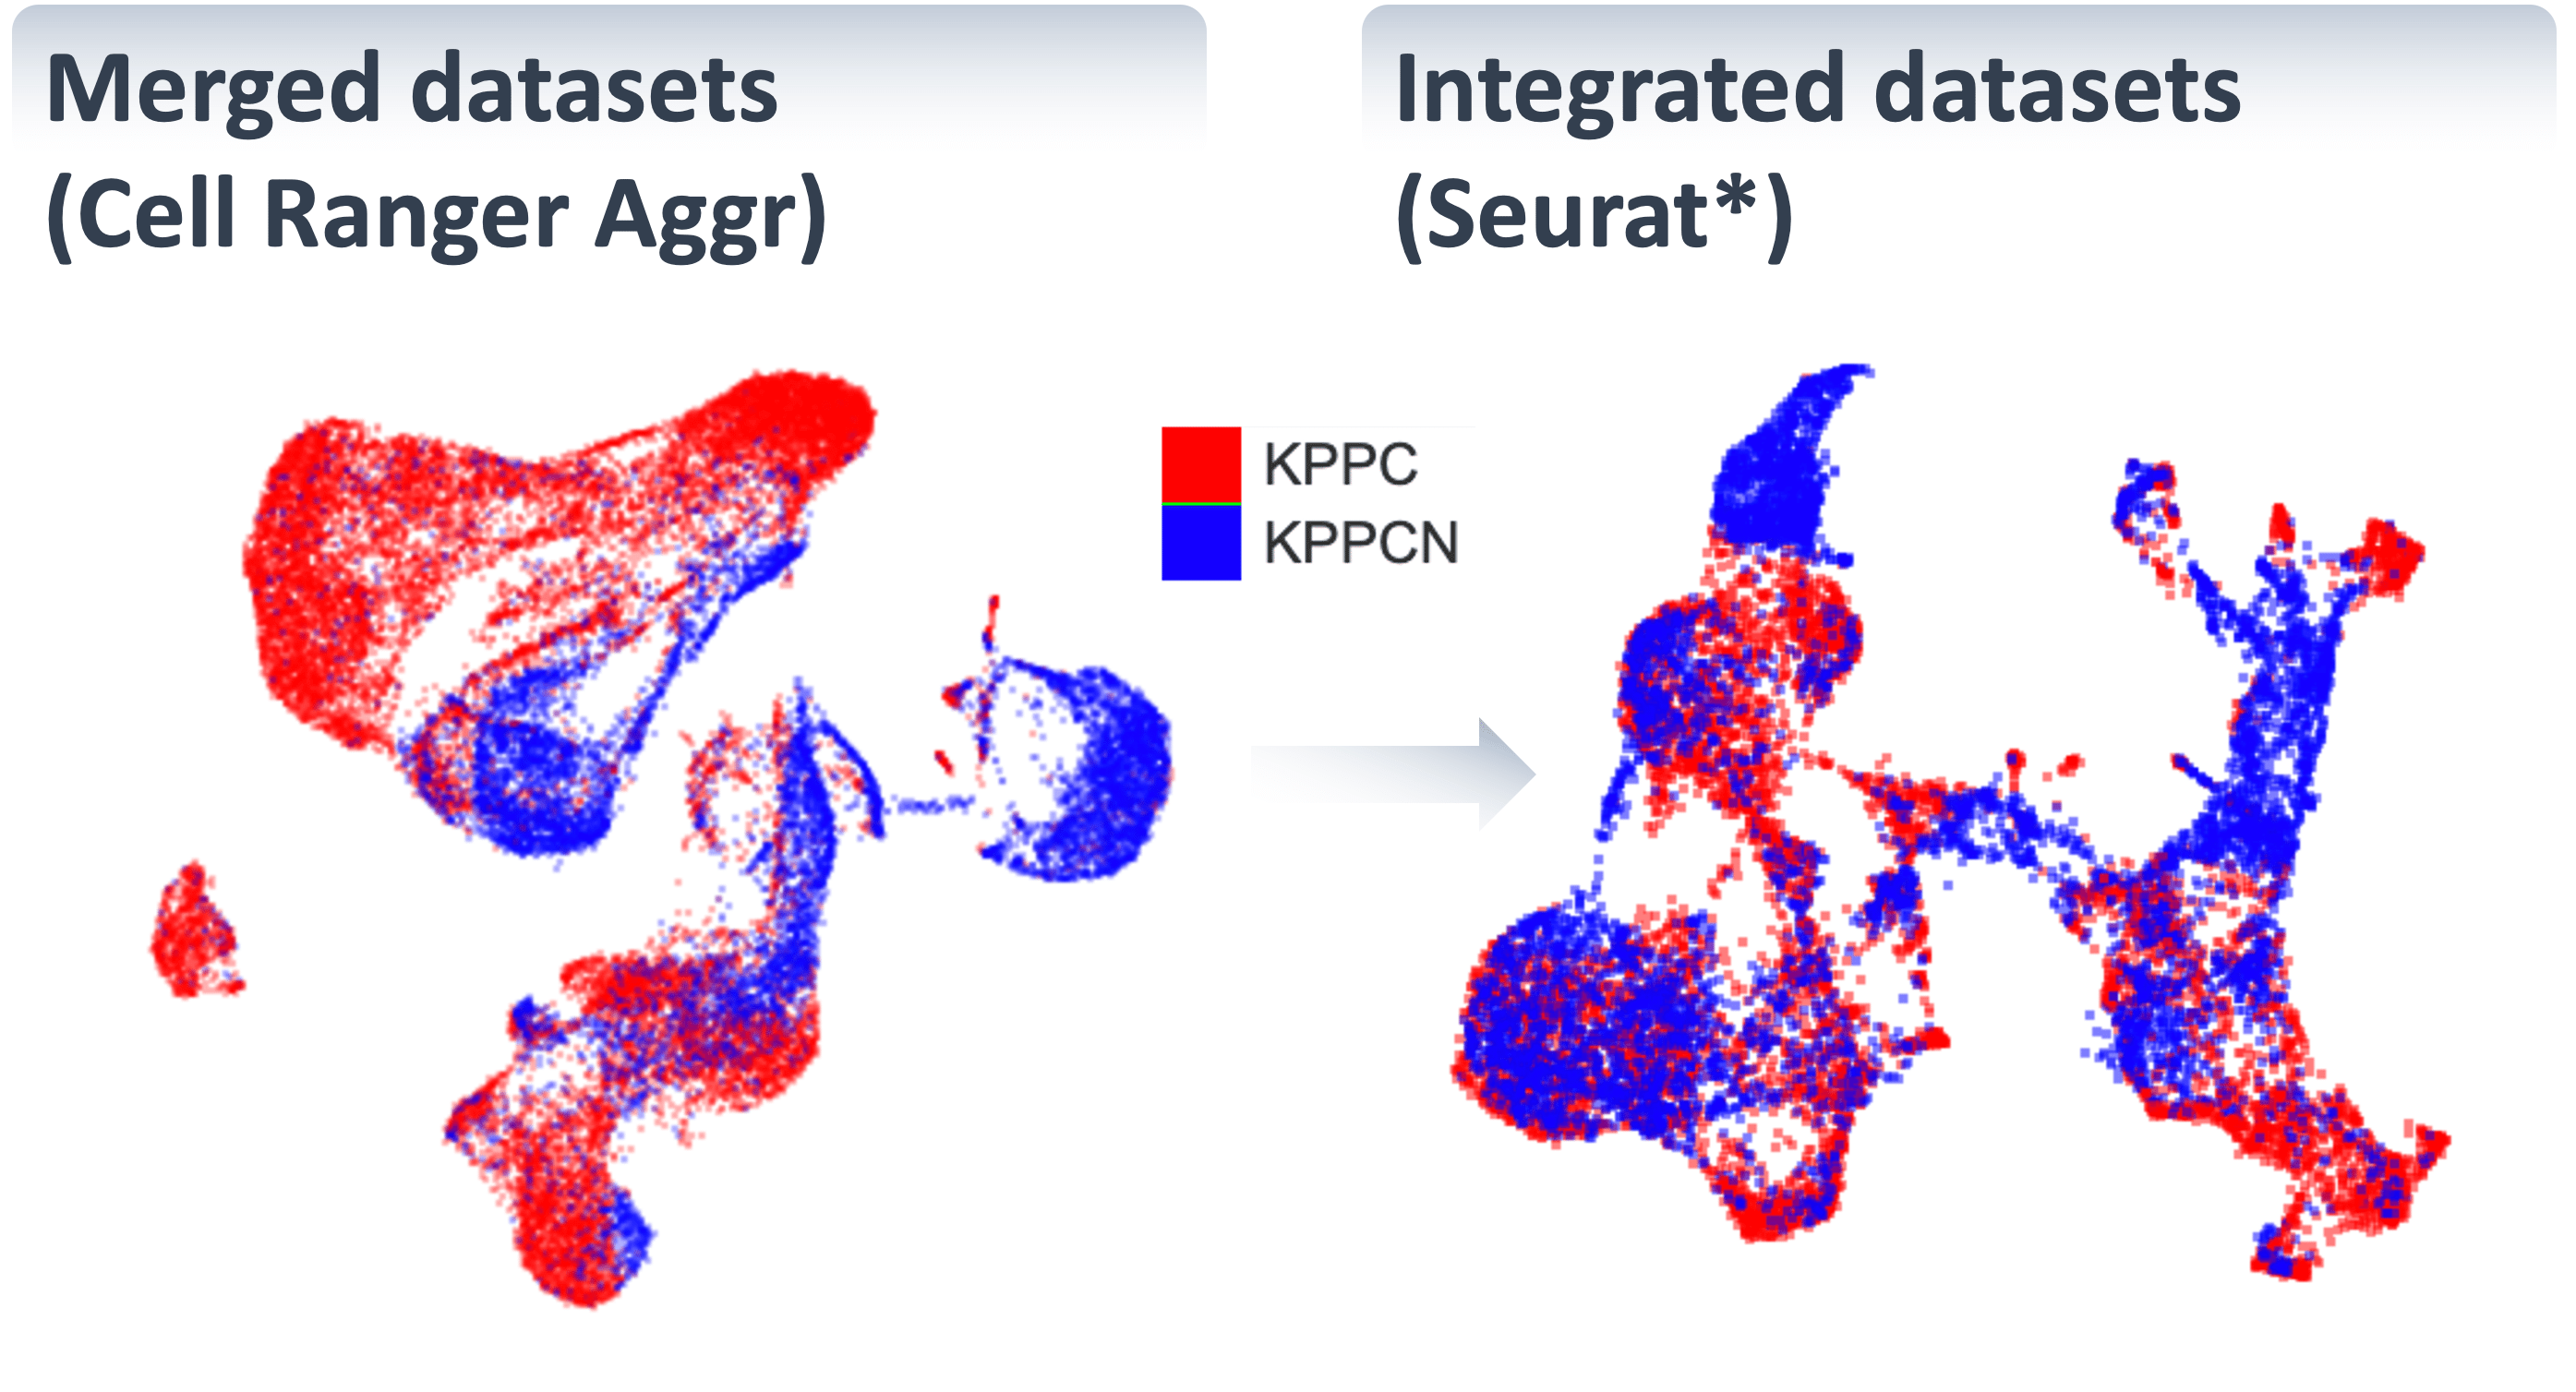
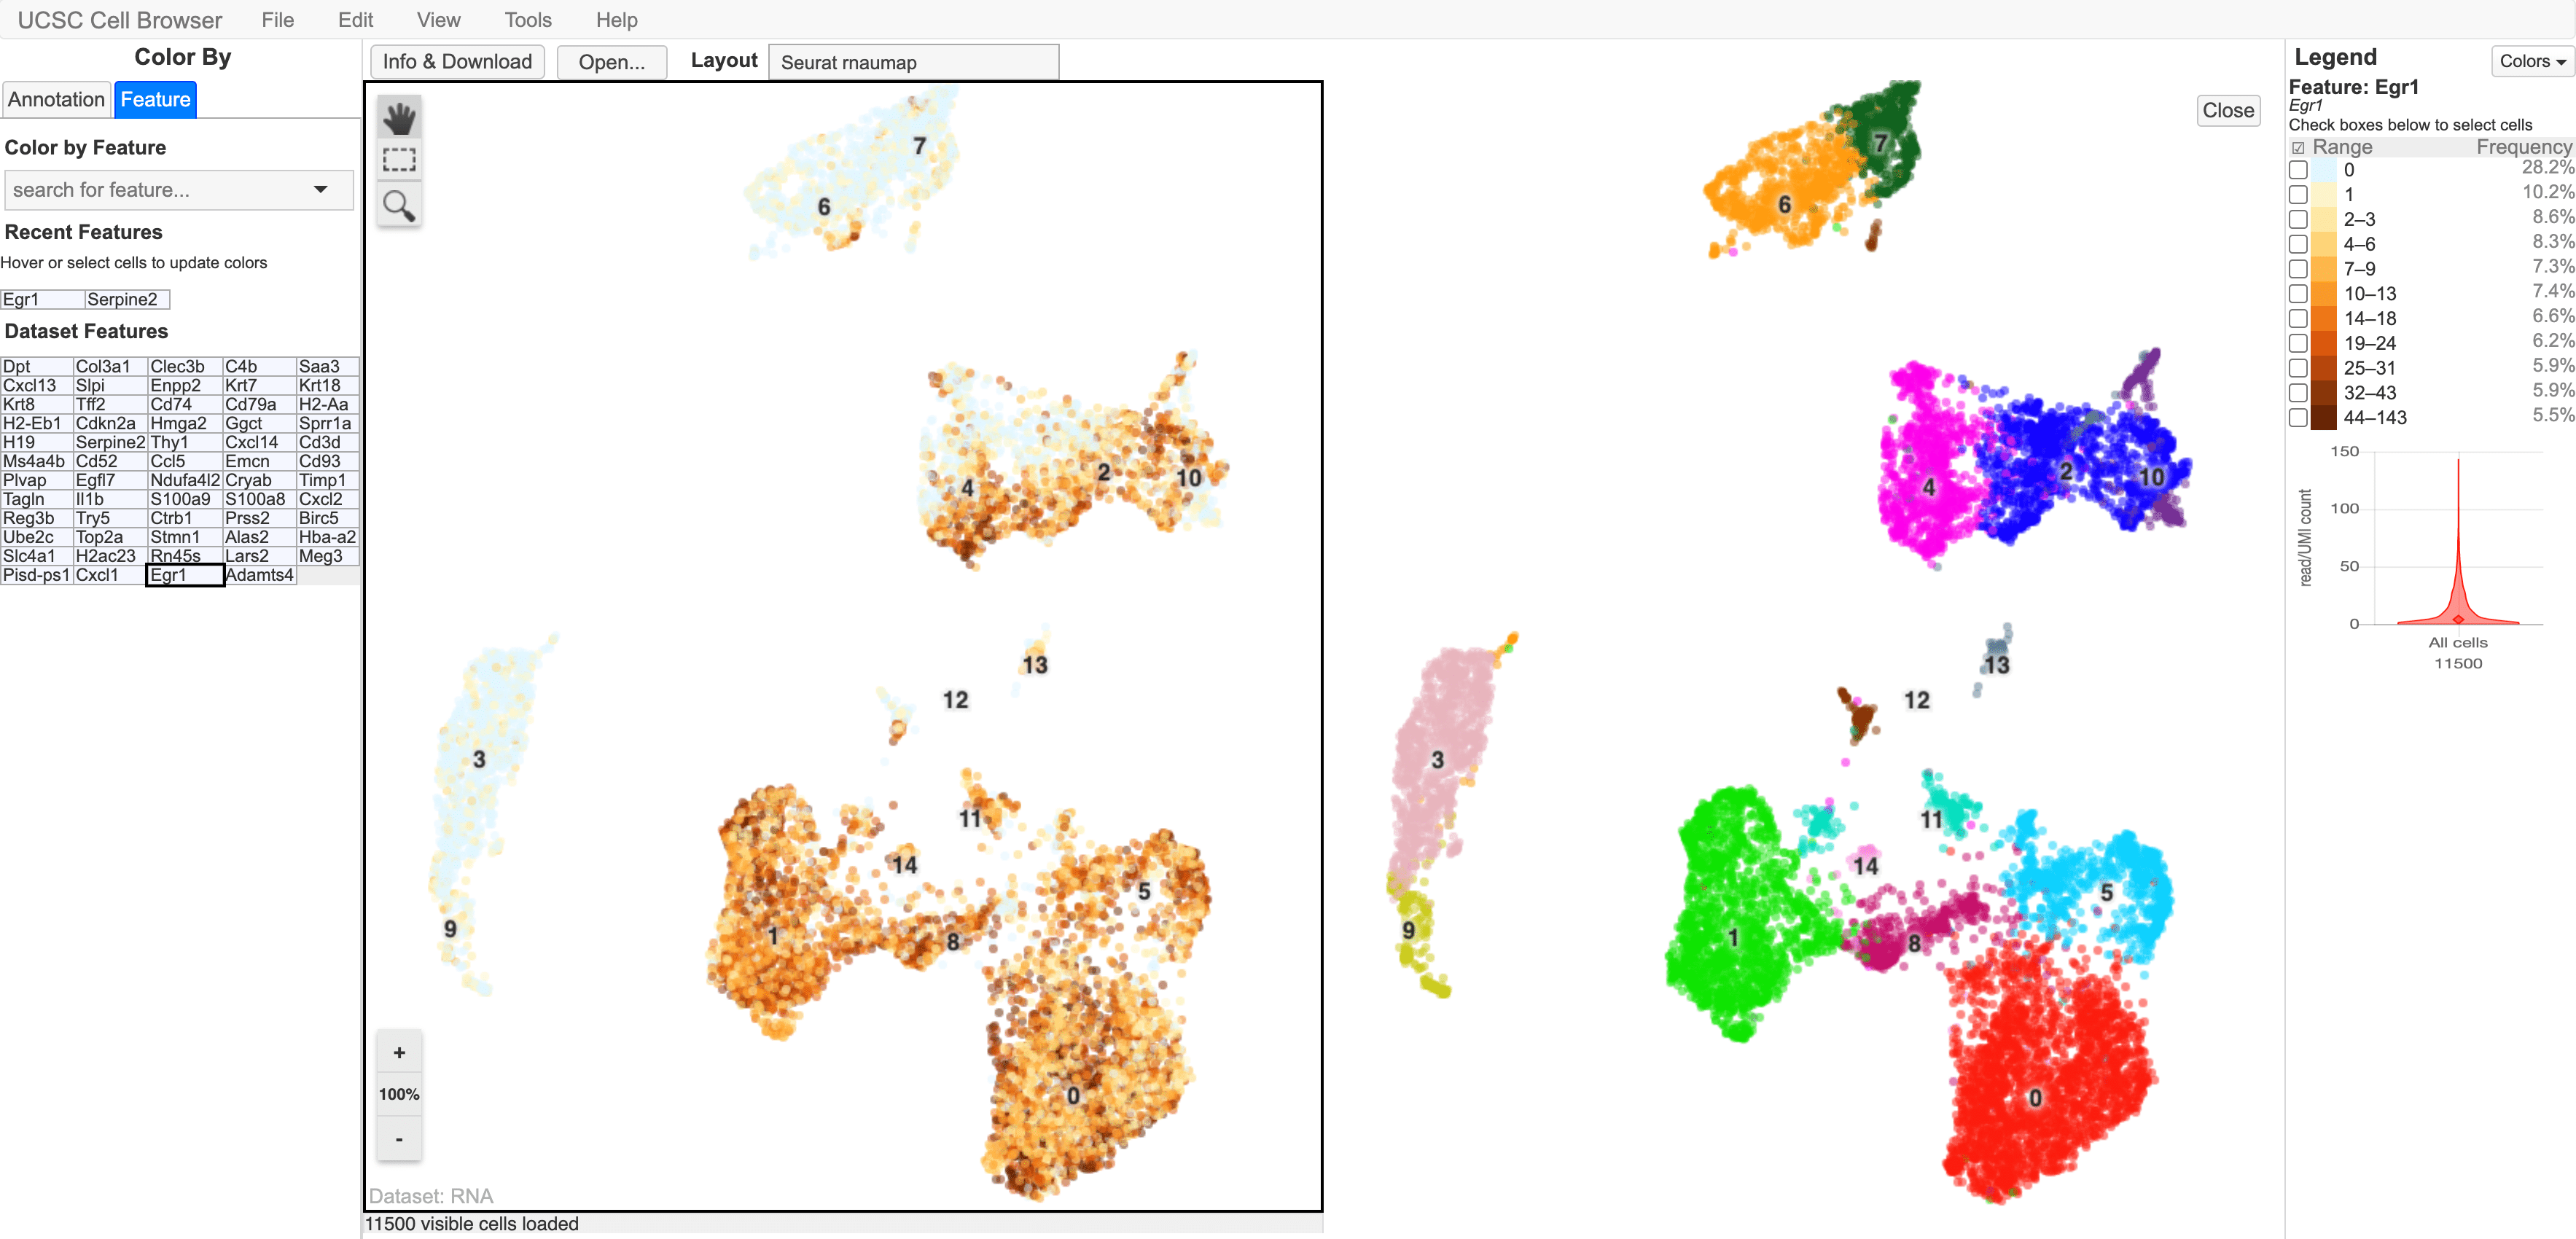
Starting with FASTQ files, analysis of single cell RNA-Seq data begins with raw data quality control (QC) and read trimming followed by alignment of reads against a reference transcriptome. Specific algorithms are applied for downstream analysis such as expression estimation, and preliminary clustering. Multiple samples can be integrated and normalized with Seurat's SCTransform or Harmony. Filtering out bad cells, dimensionality evaluation and clustering is performed with Seurat. Analysis ends with summarization and visualization of results.
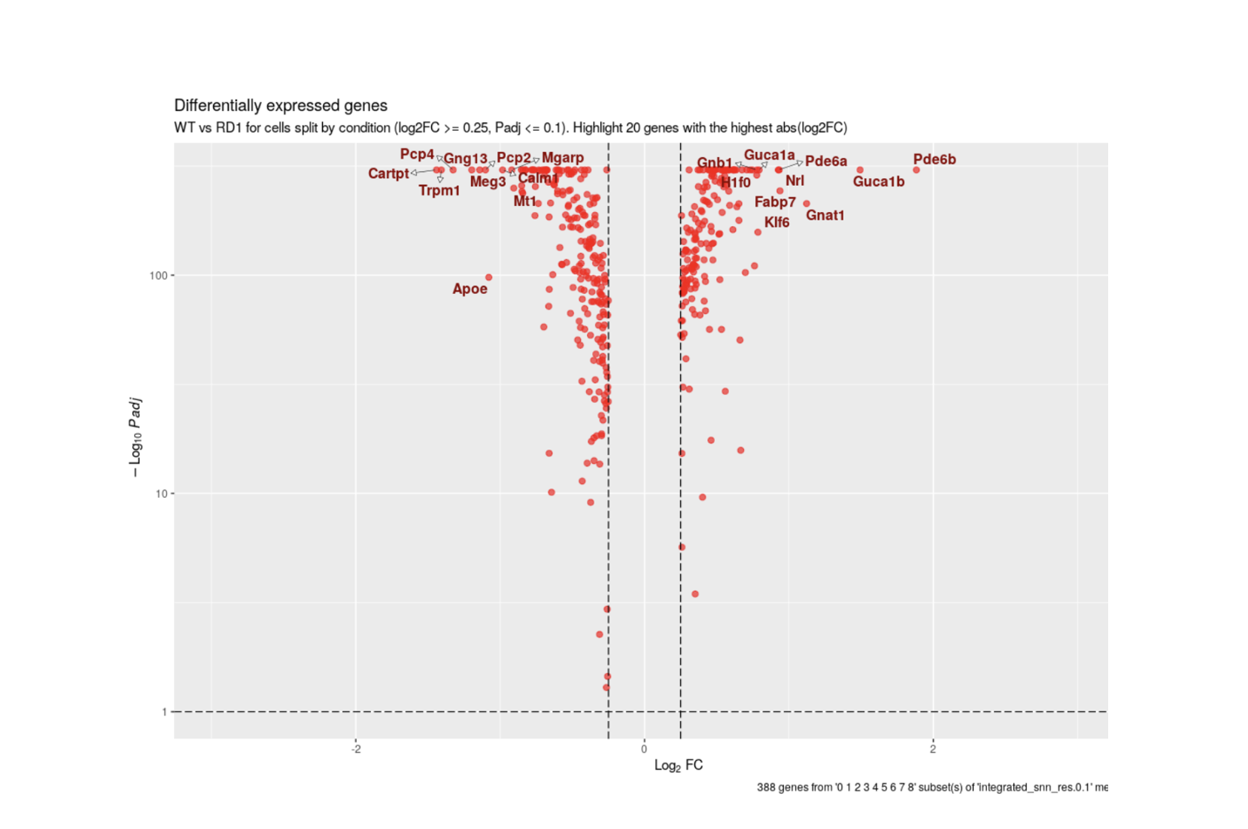
With SciDAP, you can easily identify cell types, compare expression between clusters or conditions and generate publication quality images in just a few hours.